
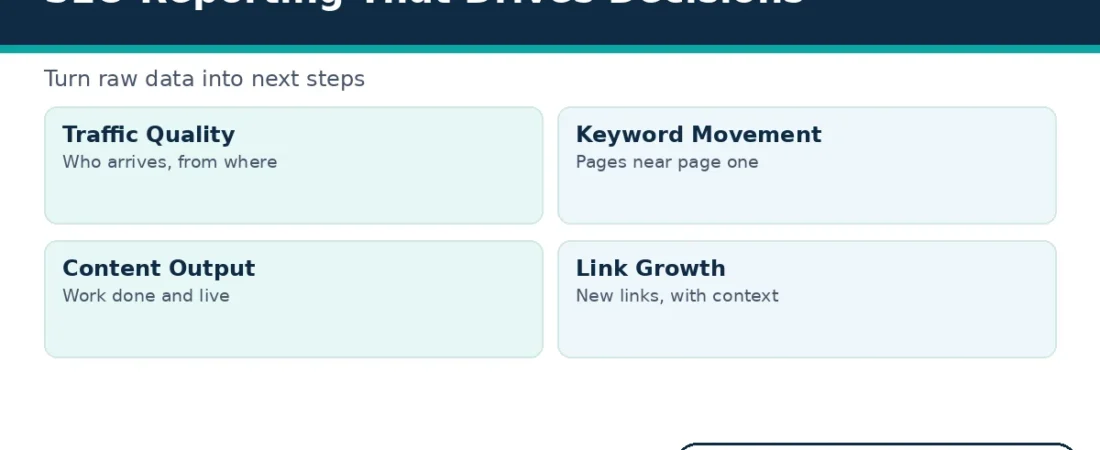
Good seo reporting exists for one reason: it tells you what to do next. A report that only lists numbers leaves the real work undone. The reader still has to guess which change matters most this month.
Many reports fail that simple test. They arrive as chart packs with no explanation and no owner for any action. This guide treats seo reporting as a decision process instead. It shows the loop, the sections and the habits that turn raw data into a plan.
You will also see worked examples along the way. Each example starts with one report line and ends with one clear decision. Nothing here relies on invented statistics or secret tools. The method works with the free tools most sites already have.
The guide suits two readers in particular. First, it suits owners who receive a monthly report from a provider and want to judge it. Second, it suits in-house marketers who produce reports and want each one to land better. Both sides gain when the report drives action instead of applause.
What SEO Reporting Is Really For
At its core, seo reporting answers three questions. What changed since the last period? Why did it change? And what will we do about it next?
Those questions sound simple, but each one needs a different skill. The first needs clean data collection. The second needs honest analysis, not decoration. The third needs the courage to pick a few actions and drop the rest.
A useful report also respects its reader. Owners want outcomes in plain words: enquiries, sales and visibility for money pages. Teams want task level detail: which page, which change and which deadline. One document can serve both readers when it layers the detail well.
Finally, a report creates a record. Month by month, it shows which actions were taken and what followed. That record stops teams from repeating failed tactics. It also proves the value of slow, steady work.
A good report also keeps both sides honest. The provider cannot hide a quiet month behind pretty charts. The client cannot claim that nothing was done when the work log says otherwise. In short, the report becomes the shared memory of the whole engagement.
Above all, the report protects the budget. Money follows the actions that the data supports. Work that shows no effect for several periods gets questioned, then cut. That discipline matters more than any single metric inside the document.
The Four-Step SEO Reporting Loop
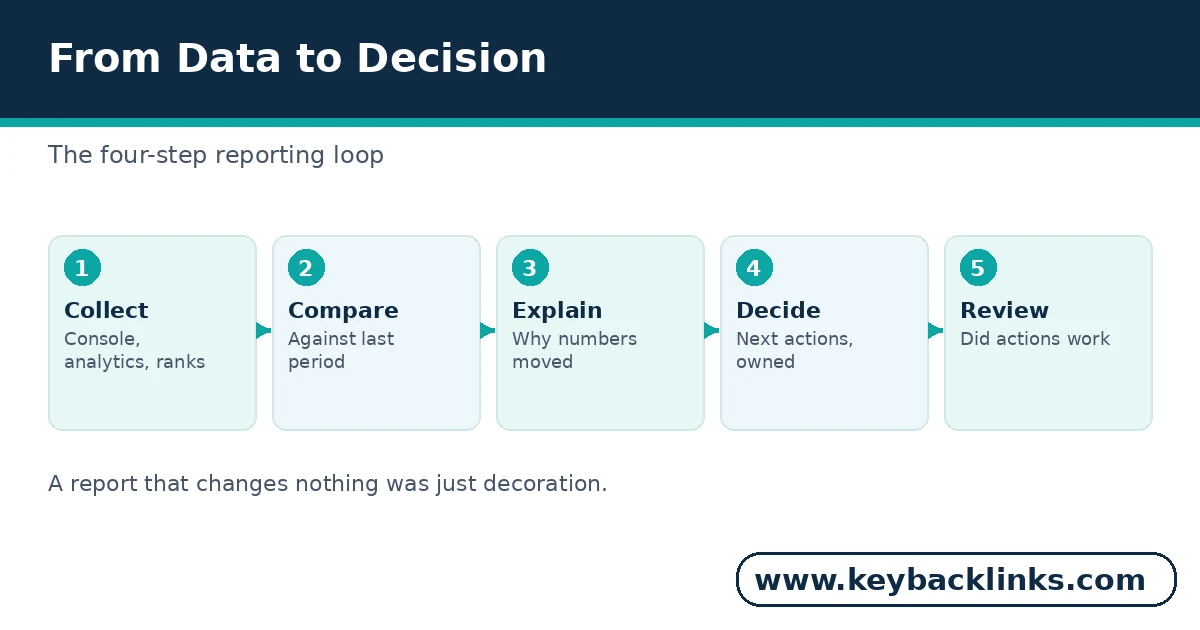
Strong teams run the same loop every month. The loop is the engine of seo reporting, and it has four steps: collect, compare, explain and decide. Skipping any step weakens the whole chain.
Collect the Right Data
First, gather the same data set every period. Pull impressions, clicks and average positions from Search Console. Add sessions and conversions from your analytics tool. Then note rankings for the pages that earn money.
Google explains the basics of helping and measuring search presence in its SEO starter guide. That free guidance covers the ground most small sites need. Expensive tools only add convenience on top of it.
Compare Against the Last Period
Next, compare each number with the period before it. Raw totals mean little on their own. A rise or fall only matters against a fair baseline.
Also compare like with like. Match a 30 day month against the previous 30 days. Note holidays, launches and site changes beside the numbers. Those notes explain many swings before analysis even starts.
Explain Why the Numbers Moved
Then explain the movement in plain language. Link each change to a likely cause: a new page, a technical fix or a lost link. Where the cause stays unclear, say so honestly.
This step separates reporting from data dumping. A chart shows that clicks fell. An explanation tells the reader whether to worry, act or wait.
Decide the Next Actions
Finally, close the loop with decisions. Each report should end with a short action list. Every action needs an owner and a date.
Keep the list short on purpose. Three to five actions beat twenty vague intentions. Next month, the loop opens by checking whether those actions happened.
What Happens When a Step Goes Missing
Each missing step creates a familiar failure. Skip collection discipline, and every month uses different numbers. Then comparisons turn into arguments about whose data is right.
Skip the explanation, and the report becomes a screenshot pack. Readers nod, learn nothing and change nothing. Skip the decision step, and even good analysis dies in the inbox.
However, the loop is forgiving when teams restart it cleanly. Pick one fixed data set, write honest explanations and close with actions. Within two or three cycles, the habit usually sticks.
Sections Every Useful SEO Report Contains
The loop needs a home, and that home is the report document. Most strong reports share the same six sections. The order below moves from summary to detail to action.
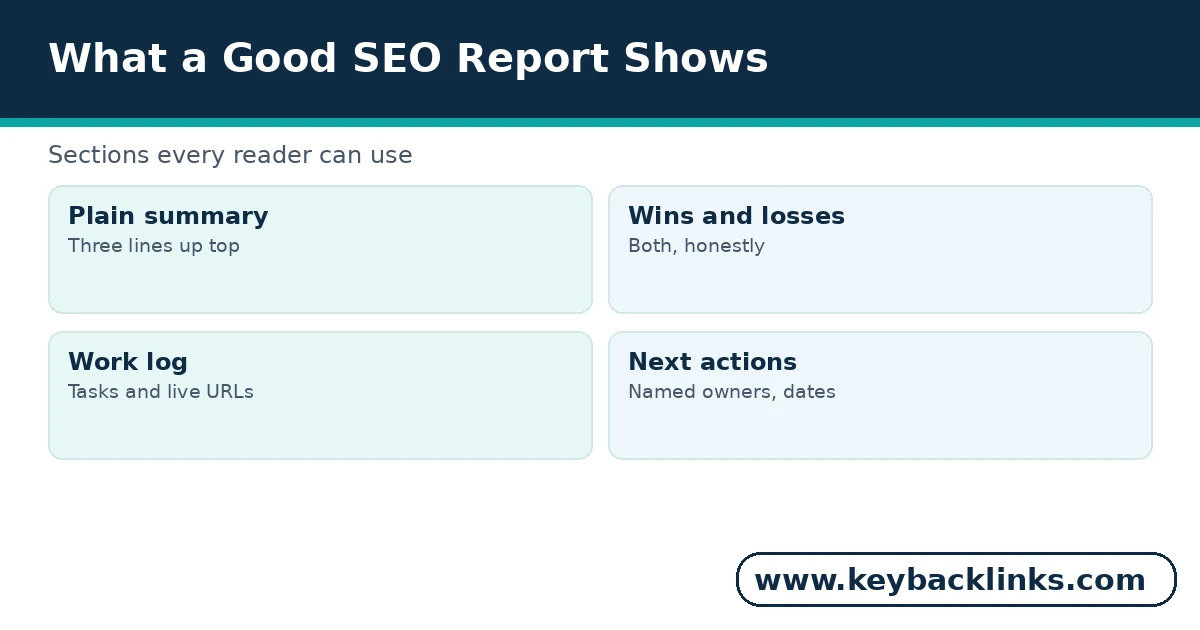
Two habits keep these sections honest. First, the work log must link to live pages, not promises. A reader should click any item and see the change.
Second, wins and losses sit side by side. A report that hides losses teaches the team to hide problems. In contrast, open losses lead to faster fixes and better plans.
The summary deserves special care, because many readers stop there. Write it last, after the detail sections are complete. Then pick only the changes that alter next month’s work. Everything else belongs deeper in the document.
Also, keep the format stable from month to month. Readers learn where each answer lives. A stable layout makes trends easy to spot and meetings shorter. Change the design only when a section stops earning its place.
Worked Examples: From a Report Line to a Decision
The sections above come alive in small, everyday calls. The examples below are short fictional scenarios. Each one shows how a single report line becomes a decision.
Example: a services page climbs from position 14 to position 9 in one month. The decision: support it now. Add internal links from related guides, refresh two weak paragraphs, and hold the link budget for other pages.
Notice what the team did not do. They did not rebuild the page or chase new keywords. The page had momentum, so the cheapest support came first.
Example: a guide keeps its ranking but loses clicks for three weeks. The decision: check the results page first. A new AI answer may now satisfy the query. So the team sharpens the intro and adds a quick answer box. It also targets a longer, more specific question instead.
Position alone would have hidden this problem. Clicks told the real story, and the report caught it early.
Example: ten new links land, yet the target page stays flat. The decision: pause new outreach for that page. First check its internal links and anchor spread, because new authority cannot help a page that the site itself barely supports.
Example: total traffic rises for two months, yet enquiries stay flat. The decision: audit the pages that gained traffic. The growth may sit on informational posts that never convert. So the team adds clear paths from those posts to the services they support.
Traffic alone would have called this a win. The conversion check changed the verdict. Therefore, every report should pair visibility numbers with at least one business outcome.
Strong seo reporting makes these calls routine. The data raises the question, and the explanation points to the cheapest sensible test.
How Often to Report, and Who Reads What
A monthly report suits most sites and most budgets. It gives changes time to register in the data. It also matches the rhythm of content and link work. Whatever the rhythm, keep seo reporting consistent from one period to the next.
However, active campaigns need lighter checks between reports. A weekly glance at rankings and indexing catches problems early. Our guide to using an seo keyword monitor shows how to watch key pages without drowning in daily noise.
Different readers also need different views of the same data. Owners read the summary, the wins and the next actions. They rarely need forty keyword rows.
Teams read the full detail instead. They need page level movement, the work log and the reasons behind each action. Therefore, build one report with layers, not two conflicting versions.
A quarterly review adds one deeper layer. Once a quarter, step back from single pages and judge whole clusters. Which topics grew, which stalled and which deserve a rebuild? That slower view shapes the next quarter’s content and link plans.
Also, agree the reporting rhythm in writing at the start. Surprises about timing cause more friction than bad numbers do. A shared calendar keeps expectations calm on both sides.
Finally, present the report in a short meeting or a recorded walkthrough. Walk through the summary first, then the biggest win and the biggest loss. End with the action list and confirm each owner aloud. That fifteen minute habit prevents most misunderstandings later.
Also, send the document before the meeting, not during it. Readers who arrive prepared ask sharper questions. Then the meeting time goes to decisions instead of first impressions.
Where Templates and Tools Fit This Process
A template and a tool both help, but neither replaces judgment. The template gives the report its shape. The tool gathers the numbers that fill it. Tools gather the data; seo reporting turns it into choices.
Our sample seo report article provides that shape. It shows a filled example with the same six sections used above. Start there if your current report is only a chart export.
For example, the filled example shows a summary written in plain sentences. It also shows a work log where each task links to a live page. Readers can copy that style directly into their own monthly document.
Tool choice comes after structure. Our backlink reporting software guide compares tools by the data they collect and the reports they produce. Pick the tool that feeds your loop, not the one with the longest feature list.
Most reports draw on four data sources. Search Console shows queries, pages and positions. Analytics adds sessions, engagement and conversions. A rank tracker watches chosen keywords between crawls. Link tools record new referring domains as they appear.
None of these sources needs to be expensive at the start. Free tiers cover a small site for months. Paid tools earn their cost when manual exports start eating real hours.
In short, the order matters. Process first, template second, tool third. Teams that reverse that order buy dashboards and still make guesses.
SEO Reporting Mistakes That Waste Good Data
Even careful teams fall into the same traps. Each mistake below wastes data that the team already owns.
Vanity Metrics Up Front
Total impressions and raw traffic look impressive in a headline. However, they rarely drive a decision on their own. Lead with money page movement and conversions instead.
Unexplained Charts
A chart without a sentence of explanation transfers the work to the reader. Most readers then skip it entirely. Therefore, every chart in seo reporting needs one line that says what changed and why it matters.
No Next Actions
The costliest mistake is a report that ends with data. Without owners and dates, insights decay into trivia within days. Also, the next report then has nothing to check against.
Reacting to Every Small Swing
Daily position changes are mostly noise, especially beyond page one. Teams that chase each swing rewrite pages too often. Then nothing stays live long enough to judge fairly. Monthly comparisons smooth that noise into a readable trend.
One Flat Report for Every Reader
A single flat document serves nobody well. Owners drown in detail while teams starve for it. Layer the report, as described above, and both readers win.
How KeyBacklinks Reports Its Work
Our own seo reporting follows the same loop for link building clients. Each report lists the work done, with live linking URLs, anchor text and target pages. It then shows movement on the pages those links support.
We add plain explanations beside the numbers. Where a page stalls, the report says why we think so. It also names the next action and its owner on our side.
Clients can also check most items themselves. Every live URL opens in a browser. Every target page shows the change we described. That openness is deliberate, because trust should never depend on our word alone.
That standard keeps our work easy to audit at any time. If you want reporting like this behind your link building, request a free quote and tell us which pages matter most to your business.
Frequently Asked Questions
What should an SEO report include?
It should include a plain summary, wins and losses, and a work log with live URLs. It also needs keyword and page movement, link growth and next actions with owners. Those six sections cover data, proof and decisions in one document.
How often should seo reporting happen?
Monthly reporting suits most sites, because changes need time to show in the data. Add light weekly checks during active campaigns or after big site changes. Daily reporting usually creates noise and rushed decisions.
What is the difference between seo reporting and a dashboard?
A dashboard shows live numbers without explanation or decisions. A report adds comparison, causes and next actions on top of the same data. In short, the dashboard informs, while the report directs the work.
How do I know if my SEO work is actually paying off?
Look for steady gains on the pages that earn money, not just site wide traffic. Check that enquiries or sales from organic search rise over several months. Also confirm that each report’s actions were done and reviewed.
Conclusion
In short, seo reporting earns its keep when it changes what happens next. The four step loop keeps the process honest: collect, compare, explain and decide. The six sections then give every reader the right level of detail.
Start with your next report, even if it feels rough. Add explanations, name the owners and close with actions. Within a few months, the record itself becomes your strategy guide.
Above all, judge every report by one simple test. Did it change what the team does next? A report that passes that test is working, however plain it looks.